Material Properties of Glass
Scott Prahl
Sept 2023
This replicates many plots found in Ghatak in chapter 6 to illustrate the changes in material properties with wavelength.
[1]:
%config InlineBackend.figure_format='retina'

import sys
import scipy
import numpy as np
import matplotlib.pyplot as plt

if sys.platform == "emscripten":
    import micropip
    await micropip.install("ofiber")

import ofiber
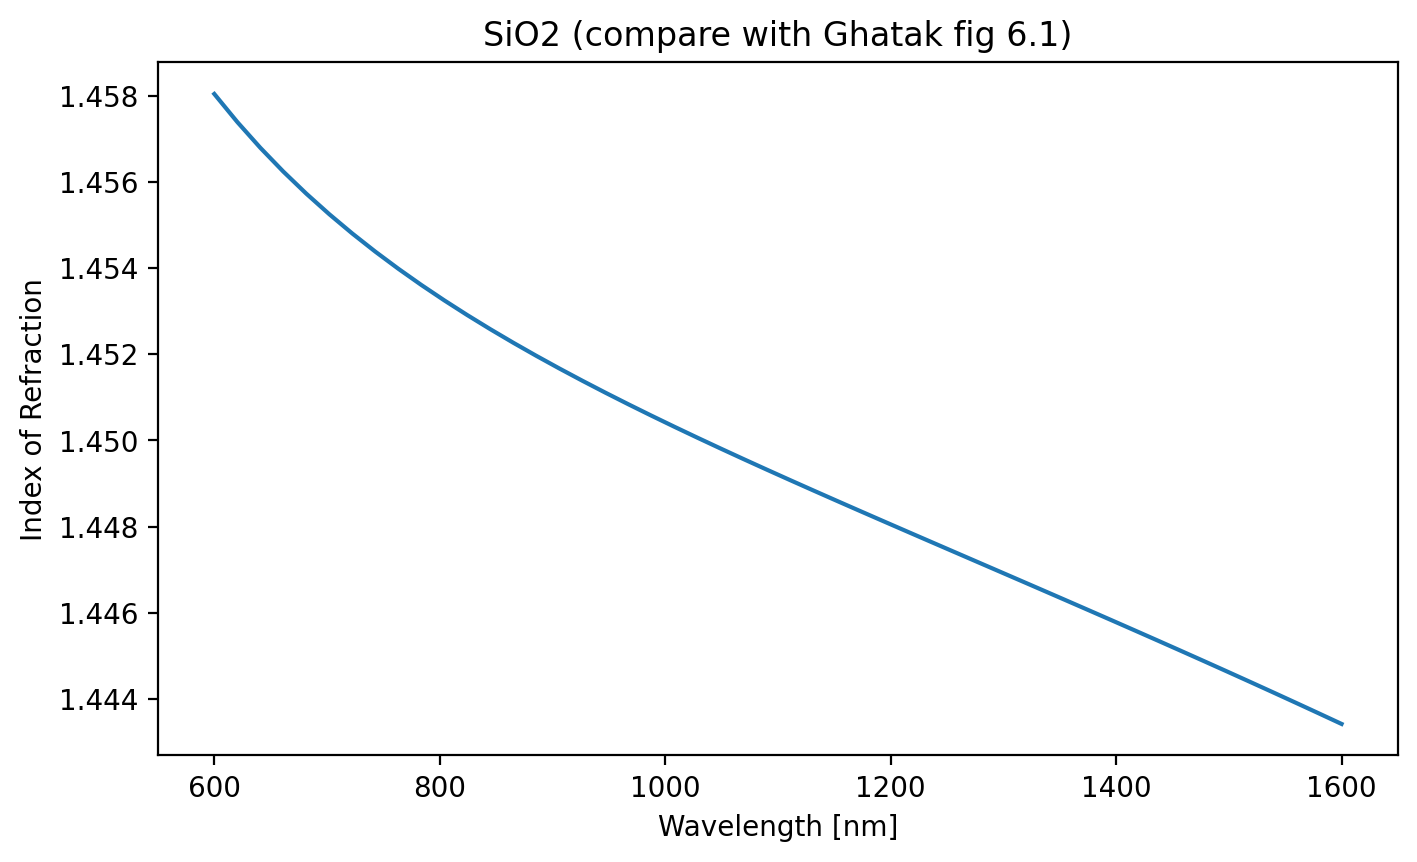
Ghatak figure 6.1
[2]:
λ = np.linspace(600, 1600, 50) * 1e-9

glass = ofiber.glass(0)
name = ofiber.glass_name(0)
n = ofiber.n(glass, λ)
plt.figure(figsize=(8, 4.5))
plt.plot(λ * 1e9, n)
plt.title(name + " (compare with Ghatak fig 6.1)")
plt.xlabel("Wavelength [nm]")
plt.ylabel("Index of Refraction")
plt.show()
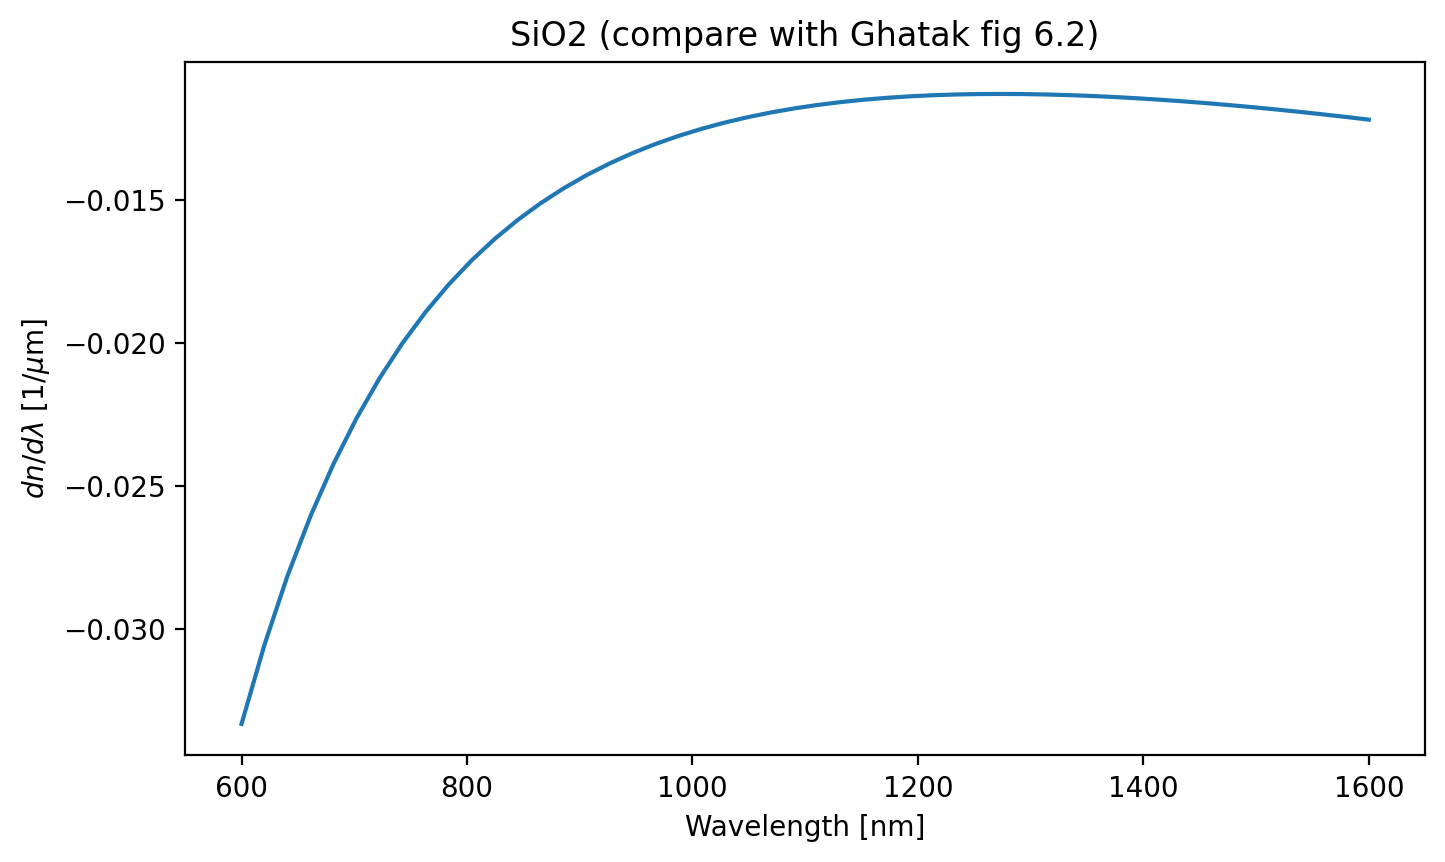
Ghatak figure 6.2
[3]:
λ = np.linspace(600, 1600, 50) * 1e-9

glass = ofiber.glass(0)
name = ofiber.glass_name(0)

dn = ofiber.dn(glass, λ) * 1e-6
plt.figure(figsize=(8, 4.5))
plt.plot(λ * 1e9, dn)
plt.title(name + " (compare with Ghatak fig 6.2)")
plt.xlabel("Wavelength [nm]")
plt.ylabel(r"$dn/d\lambda$ [1/$\mu$m]")
plt.show()
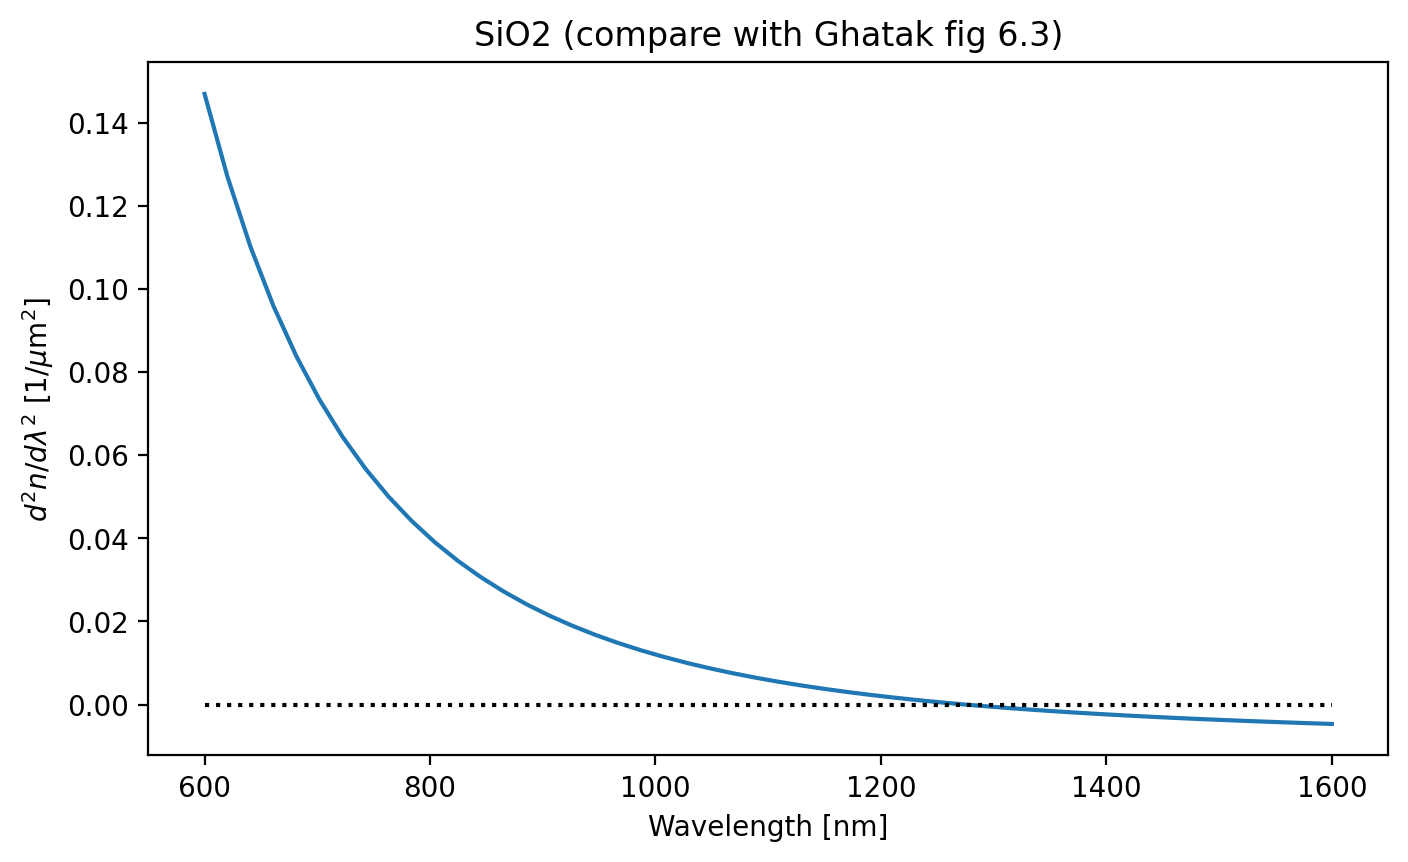
Ghatak figure 6.3
[4]:
λ = np.linspace(600, 1600, 50) * 1e-9

glass = ofiber.glass(0)
name = ofiber.glass_name(0)

d2n = ofiber.d2n(glass, λ) * 1e-12
plt.figure(figsize=(8, 4.5))
plt.plot(λ * 1e9, d2n)
plt.plot([600, 1600], [0, 0], ":k")
plt.title(name + " (compare with Ghatak fig 6.3)")
plt.xlabel("Wavelength [nm]")
plt.ylabel(r"$d^2n/d\lambda^2$ [1/$\mu$m$^2$]")
plt.show()
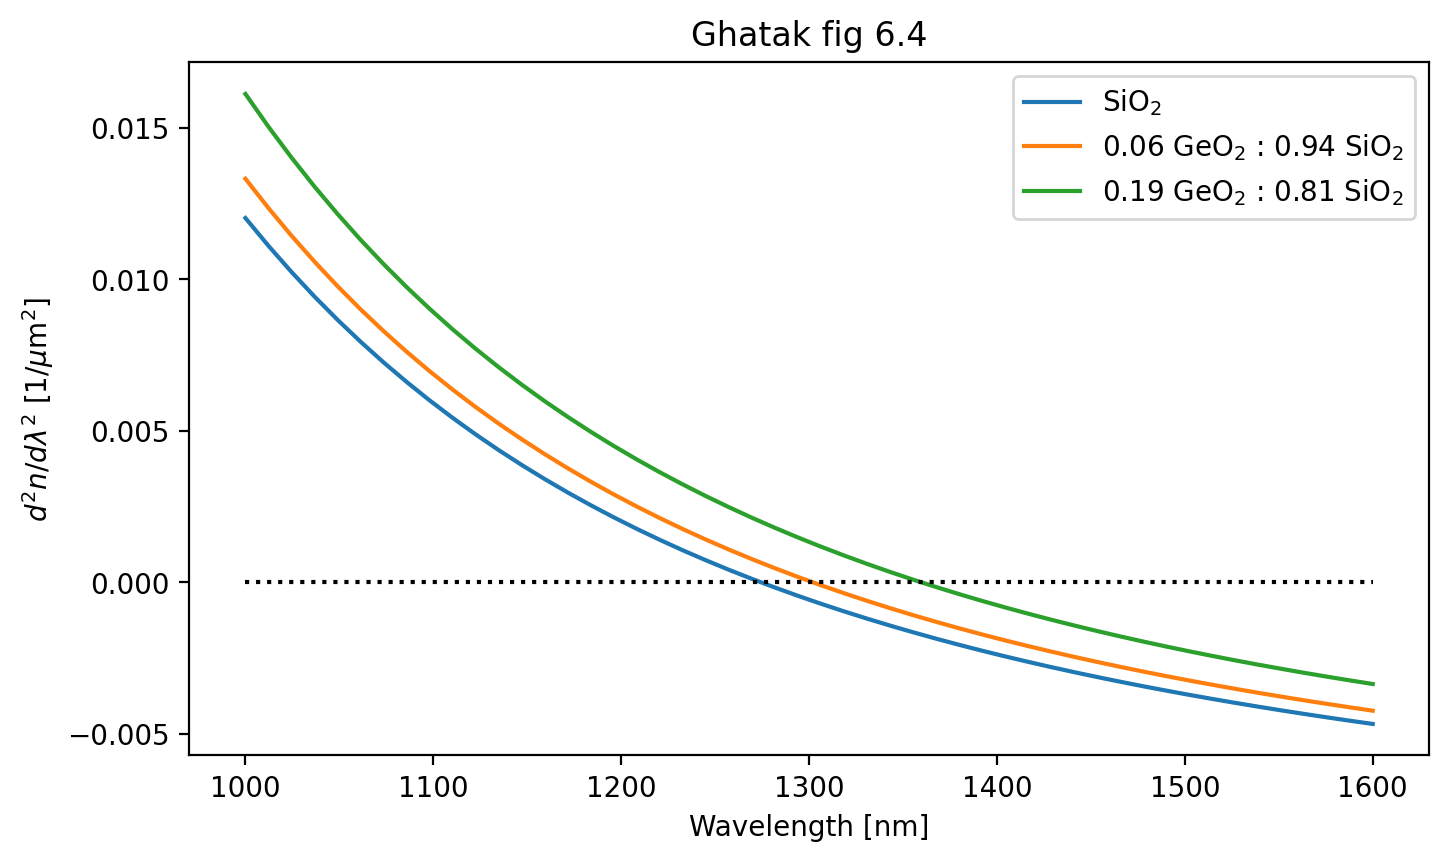
Ghatak figure 6.4
[6]:
λ = np.linspace(1000, 1600, 50) * 1e-9

plt.figure(figsize=(8, 4.5))
for x in [0, 0.063, 0.193]:
    glass = ofiber.doped_glass(x)
    name = ofiber.doped_glass_name(x)
    d2n = ofiber.d2n(glass, λ) * 1e-12
    plt.plot(λ * 1e9, d2n, label=name)

plt.plot([1000, 1600], [0, 0], ":k")
plt.title("Ghatak fig 6.4")
plt.xlabel("Wavelength [nm]")
plt.ylabel(r"$d^2n/d\lambda^2$ [1/$\mu$m$^2$]")
plt.legend()
plt.show()
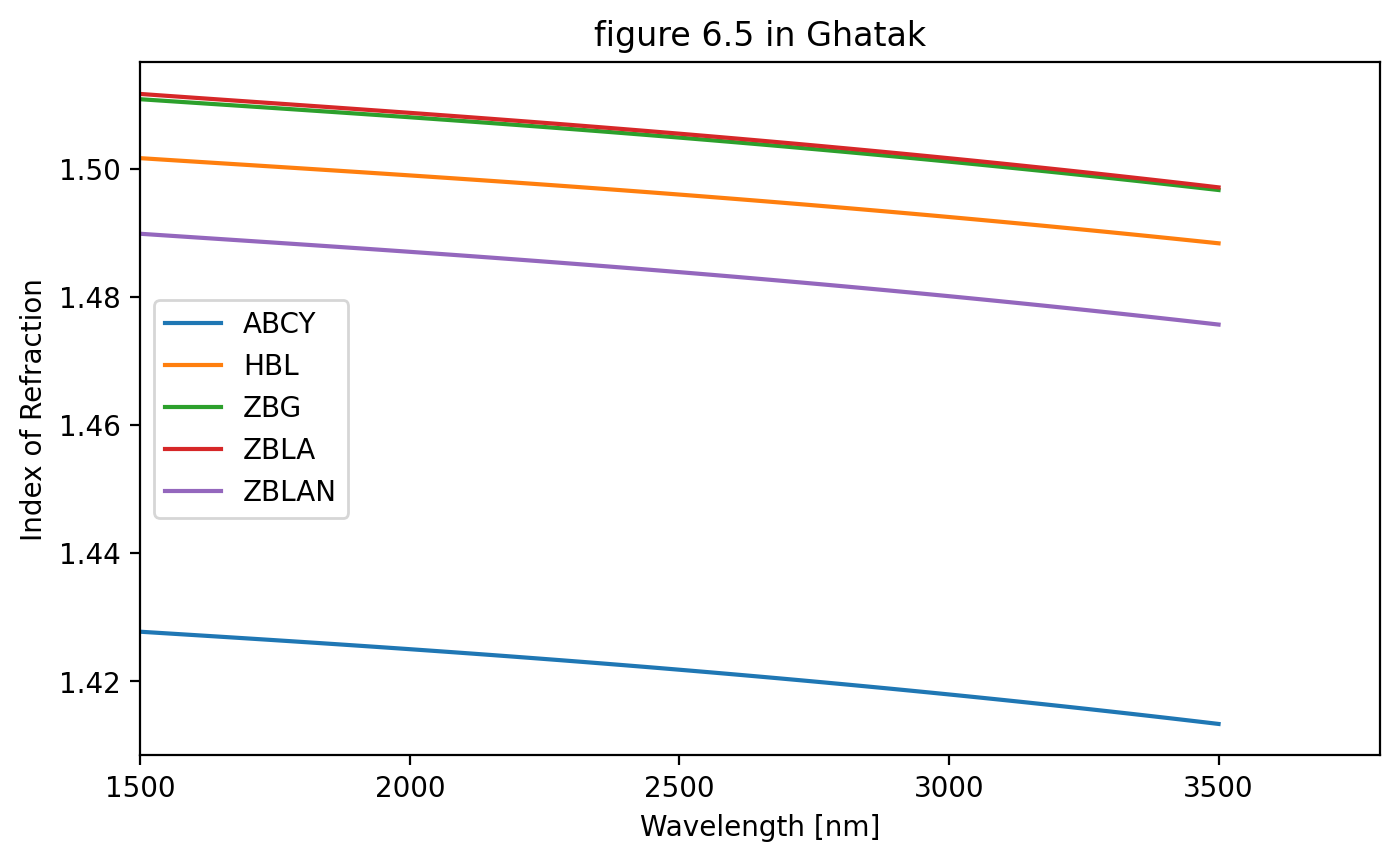
Ghatak figure 6.5
[7]:
plt.figure(figsize=(8, 4.5))

λ = np.linspace(1500, 3500, 50) * 1e-9
for i in range(6, 11):
    glass = ofiber.glass(i)
    name = ofiber.glass_name(i)
    n = ofiber.n(glass, λ)
    plt.plot(λ * 1e9, n, label=name)

plt.xlim(1500, 3800)
plt.xlabel("Wavelength [nm]")
plt.ylabel("Index of Refraction")
plt.title("figure 6.5 in Ghatak")
plt.legend()
plt.show()
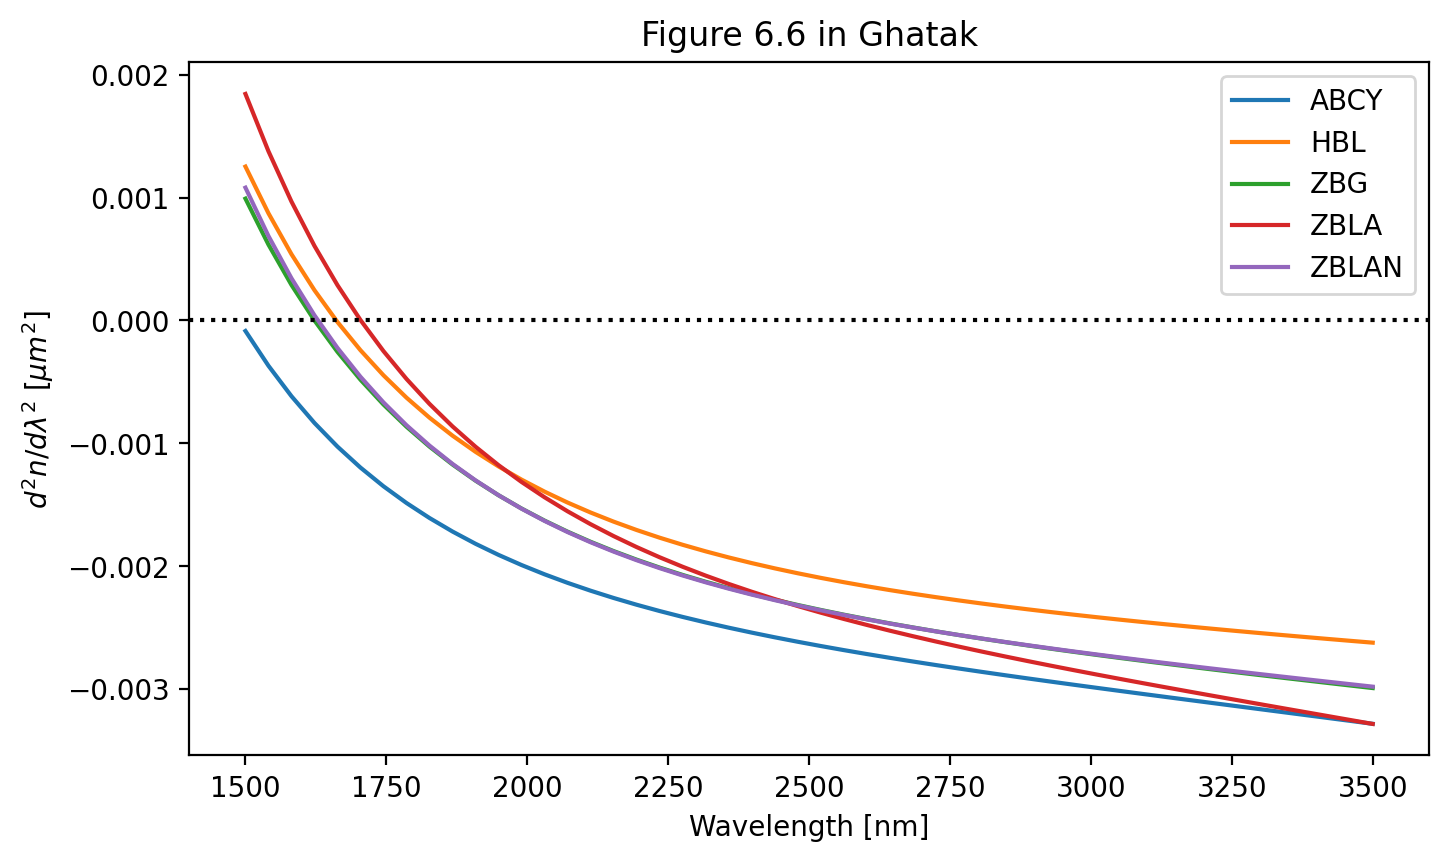
Ghatak figure 6.6
[8]:
plt.figure(figsize=(8, 4.5))
λ = np.linspace(1500, 3500, 50) * 1e-9
for i in range(6, 11):
    glass = ofiber.glass(i)
    name = ofiber.glass_name(i)
    d2n = ofiber.d2n(glass, λ) * 1e-12
    plt.plot(λ * 1e9, d2n, label=name)


plt.axhline(0, color="black", ls=":")
plt.xlabel("Wavelength [nm]")
plt.ylabel(r"$d^2n/d\lambda^2$ [$\mu m^2$]")
plt.legend(loc="upper right")
plt.title("Figure 6.6 in Ghatak")
plt.show()
[ ]: